WHO Child Growth Standards

Baby percentile calculator (WHO, 0–24 months)

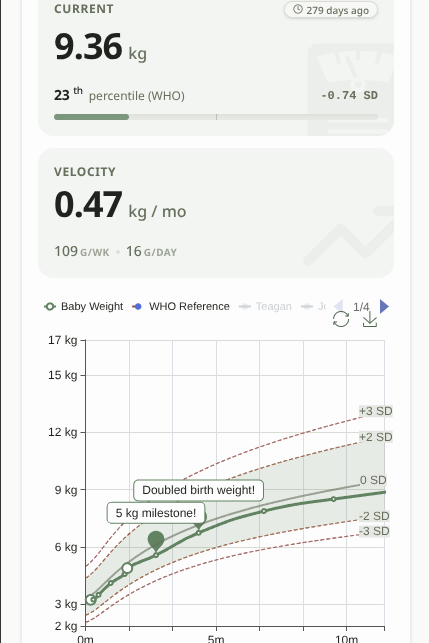
Enter your baby's birth date, sex, and a measured weight, length, or head circumference to see their percentile on the WHO Child Growth Standards — the reference charts pediatricians use.

Source: WHO Child Growth Standards . Percentiles are calculated from the WHO LMS reference data (weight-for-age, length/height-for-age, and head-circumference-for-age). Not medical advice — share results with your pediatrician.

What does a baby growth percentile mean?

A percentile is a comparison, not a target. If your baby is at the 60th percentile for weight, that means about 60% of healthy same-age, same-sex babies in the WHO reference population weigh less, and about 40% weigh more. The number says where your baby sits on a curve — it does not say whether your baby is "big enough" or "too small."

This calculator uses the WHO Child Growth Standards , built from the WHO Multicentre Growth Reference Study (1997–2003), which measured healthy breastfed infants in six countries. The standards describe how children should grow when conditions are right, which is why WHO charts are the default in pediatric care worldwide. Our calculator computes your baby's exact position on the WHO LMS curves (weight-for-age, length/height-for-age, and head-circumference-for-age) rather than rounding to a printed table.

Three practical habits make percentile tracking useful. First, measure consistently — same time of day, same scale or measuring board, ideally without clothes for weight. Second, look at the trend over time, not a single number: pediatricians care most about whether your baby follows their own curve. A temporary dip around an illness is normal. Third, remember the typical band: about 95% of healthy babies fall between the 3rd and 97th percentiles, so being on either side of the median is completely normal.

When should you call your pediatrician? If your baby's percentile drops sharply across two or more visits, if growth stalls entirely, or if weight-for-age falls below the 3rd percentile for an extended period, a clinician should look at the whole picture. Percentiles are a screening tool — they flag questions, they don't answer them.

WHO median weight-for-age, 0–24 months

The median (50th percentile) weight in kilograms by age, from the WHO weight-for-age standards. Half of healthy boys or girls weigh more, half weigh less. Use the interactive calculator above for any age in days and any percentile.

AgeBoys (kg)Girls (kg)
0 months3.35 kg3.23 kg
1 month4.45 kg4.17 kg
2 months5.57 kg5.13 kg
3 months6.39 kg5.86 kg
4 months7.01 kg6.43 kg
5 months7.52 kg6.91 kg
6 months7.95 kg7.31 kg
9 months8.89 kg8.22 kg
12 months9.65 kg8.95 kg
15 months10.31 kg9.60 kg
18 months10.94 kg10.23 kg
24 months12.15 kg11.47 kg

Source: WHO Child Growth Standards — weight-for-age tables, median values rounded to two decimals.

Frequently asked questions

What's a "normal" percentile?

Almost any percentile is normal on its own. About 95% of healthy babies fall between the 3rd and 97th percentiles, and babies at the 5th or 95th percentile can be perfectly healthy. What matters is the trend: pediatricians look at whether your baby follows their own curve over several measurements, not whether a single number matches the median.

How should I measure my baby?

Weigh your baby at roughly the same time of day, ideally before a feed and without clothes. For length, lay your baby flat and measure from the top of the head to the heel — stretching the legs slightly. Head circumference goes around the widest part of the head, just above the eyebrows and ears. Consistency beats precision: the same method each time makes the trend reliable.

Weight or length — which matters more?

Both, in context. Weight-for-age catches overall nutrition, length/height-for-age reflects longer-term growth, and head-circumference-for-age tracks brain growth in the first months. Doctors often look at weight-for-length (proportionality) too. Log all three and you'll see a fuller picture than any single number.

Where does the WHO data come from?

The WHO Child Growth Standards come from the Multicentre Growth Reference Study (1997–2003), which followed healthy breastfed infants in Brazil, Ghana, India, Norway, Oman, and the United States. The resulting LMS curves describe growth under optimal conditions and are recommended for children everywhere. This calculator uses the official WHO reference data directly.

Why does the calculator stop at 24 months?

The WHO age-based standards cover birth to 5 years (the tool accepts up to about 61 months), after which the WHO relies on the 2007 growth reference for school-age children and adolescents. For older children your pediatrician switches to those charts, so the percentile would no longer be comparable.

How do I track growth over time?

Record every measurement in one place with the date and your baby's age. Storklet plots each measurement on the WHO percentile chart automatically and shows the curve over months — that curve is exactly what your pediatrician will want to see. Save your first measurement here and the trend builds itself.

Percentiles are just the start

The growth and milestones tracker in Storklet turns single measurements into a full WHO growth chart, alongside vaccine schedules, milestones, and symptom logs your care team can share.

ennllt-ltpt-br